- Market timing is difficult and obsessing about it may be unwarranted for the consistent long-term investor
- Famed mutual fund manager Peter Lynch conducted a study that is often cited by investment professionals—to demonstrate that market timing is “a waste of time”—but he never publicly provided numerical details nor backup; this article conveys real-world numbers on Lynch’s concept by replicating it with modern funds across recent decades
- From 1994 to 2020, the annual-return difference between the absolute worst-timed unlucky investor, the absolute best-timed lucky investor, and a start-of-the-year investor in an S&P 500 fund was 8.7%, 10.2%, and 9.6% respectively—an annualized difference of only 1.5% between the worst-timed and an omniscient best-timed investor[i]
- More-volatile markets will accentuate the difference between the unlucky investor and the omniscient lucky investor
- Where one invests—i.e., which broad-based stock index one chooses to track—may be more critical than when one invests
- Having a consistent financial plan and sticking to it is a critical component of long-term investing
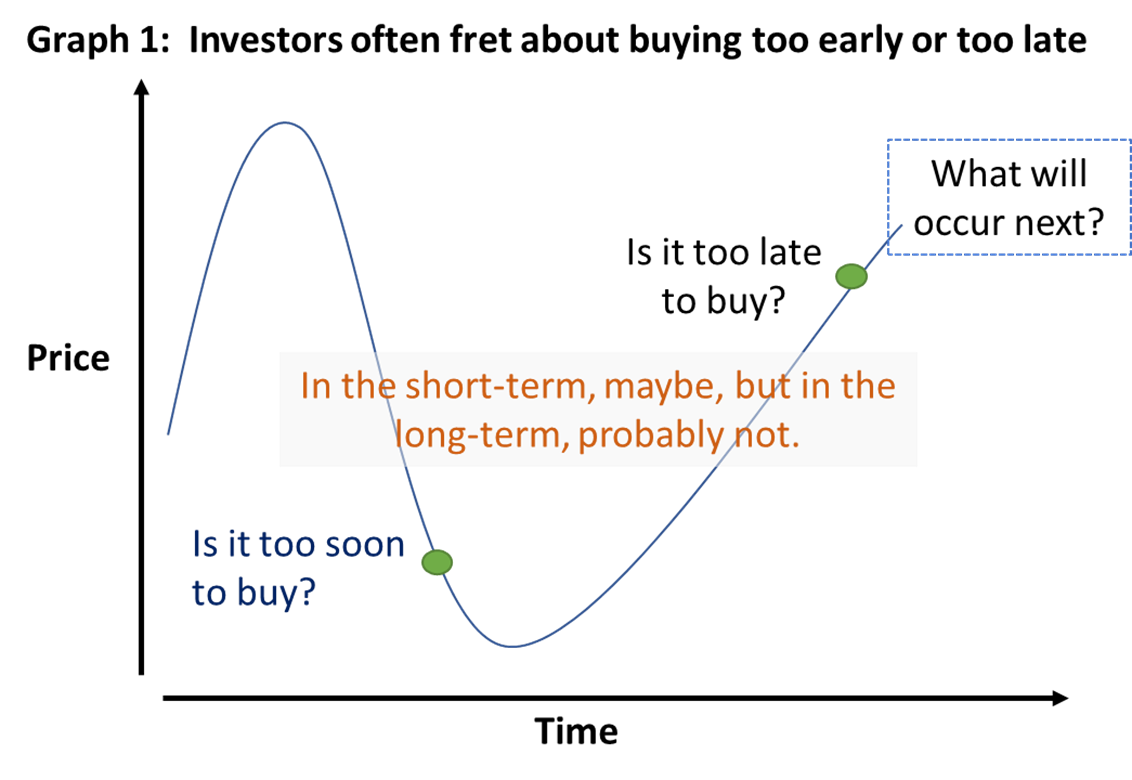
Background—Peter Lynch’s original mid-1990s study: People want to buy low and sell high, or more specifically, over a given period, people desire to purchase their investments at the lowest price possible and sell them at the highest price possible and then frequently repeat this magic formula to increase wealth. Most people, however, realize how absolutely difficult perfect market timing is. More commonly, investors worry not so much about perfect timing, but rather about buying a little too early[ii] if an investment’s price has been on a downtrend, or buying near the top over a given period if an investment’s price has been in a flat or uptrend[iii]. People dislike the feeling of being wrong in the short[iv]– to medium-term; that is, seeing lower prices in the days[v] or weeks after an investment purchase.
Famed mutual fund manager and philanthropist Peter Lynch ran Fidelity’s Magellan Fund (a U.S. equity mutual fund) for 13 years from 1977 to 1990 and made it the best-performing mutual fund in the world.[vi] After retiring as a portfolio manager, he spoke and wrote several times about a study he conducted on the futility of investment market timing. He compared the cumulative returns of three fictional long-term investors—one with the worst possible annual market timing, a second with perfect annual market timing, and a third who invested regularly at the start of every year—and concluded that “people spend an unbelievable amount of mental energy trying to pick what the market’s going to do, what time of the year to buy it. It’s just not worth it.” In January 1997, Lynch provided the following example in an article for Worth Magazine[vii] titled “Pain and Gain”:
“…let me give you another example based on actual stock-market performance from 1965 through 1995, a period with good years and bad. Imagine three investors, each of whom puts $1,000 into stocks annually over these three decades. Investor 1, who is very unlucky,[viii] somehow manages to buy stocks on the most expensive day of each year. Investor 2, who is very lucky, buys stocks on the cheapest day of each year. Investor 3 has a system: She always buys her stocks on January 1, no matter what.
You’d think that Investor 2, having an uncanny knack for timing the market, would end up much richer than Investor 1, the unluckiest person on Wall Street, and would also outperform Investor 3. But over 30 years, the returns are surprisingly similar. Investor 1 makes 10.6 percent annually; Investor 2, 11.7 percent; and Investor 3, 11 percent. Even I am amazed that perfect timing year after year is worth only 1.1 percent more than horrible timing year after year.”[ix]
As far as I know—although this study is often referenced in the annals of investment lore—Lynch never provided the data behind his study; did not indicate what stocks, fund, or index his proxy investors put money into; and did not mention fees, taxes, nor expenses. Nor did he reconcile the fact that technically stocks cannot be purchased on January 1 since it is always a market holiday. Additionally, although market timing is a popular subject—and several studies, including those by Ben Carlson, CFA[x], Nick Maggiulli[xi], and Wesley Gray, PhD[xii] have tackled it—I have not found attempts to replicate or update Mr. Lynch’s study: hence this paper.
Setup—How this study was assembled: This updated study back-tests three investment timing policies on three investment funds over periods of at least 20 years. Much like Peter Lynch’s study, this study assumes three types of investors with three different timing tactics:
- Investor 1, with the unluckiest market timing, invests into a fund consistently at the closing price on the day of the highest closing price of the year, and continues to own each investment purchase (i.e., does not sell). We will call Investor 1 “Unlucky Investor”
- Investor 2, with perfect market timing, invests into a fund consistently at the closing price on the day of the lowest closing price of the year, and continues to own each investment purchase (i.e., does not sell). We will call Investor 2 “Lucky Investor”
- Investor 3 invests into a fund consistently at the closing price on the first business day of every year, and continues to own each investment purchase (i.e., does not sell). We will call Investor 3 “SOY (start-of-year) Investor”
Thus each investor implements a buy-and-hold plan, but their purchase timing is radically different.
The three investment policies are tested with three popular U.S. equity exchange traded funds (ETFs). Each tracks a different, widely followed U.S. equity index, is readily available, easy to purchase, very liquid[xiii], and has at least a 20-year track record:
- SPDR S&P 500 ETF Trust, ticker symbol SPY, tracks the S&P 500 Index—a U.S. equity index of large-capitalization stocks; it has an expense ratio of 0.095%
- iShares Russell 3000 ETF, ticker symbol IWV, tracks the Russell 3000 Index—a U.S. equity index of large-, mid-, and small-capitalization stocks; it has an expense ratio of 0.20%
- Invesco QQQ Trust Series 1, ticker symbol QQQ, tracks the NASDAQ-100 Index—a U.S. equity index of the largest non-financial companies by market capitalization listed on NASDAQ; it has an expense ratio of 0.20%
Note: Although the three ETFs track U.S.-based equity indices, they each have some direct foreign exposure either through directly listed foreign companies or through American depository receipts (ADRs) that comprise the indices.
SPY is the oldest and one of the best-recognized U.S.-listed ETFs, with an inception date of 1/22/1993[xiv]. IWV is the largest and only U.S.-based ETF that tracks the broad Russell 3000 capitalization-weighted index, which measures the investable U.S. equities market across a spectrum of large-, mid-, and small-cap stocks. QQQ is the largest and oldest U.S.-based ETF that tracks the NASDAQ-100 Index.[xv] These three ETFs have for more than two decades provided reasonable broad market access for institutional and individual investors.
First look—Back-testing 3 modern funds since their inception: The annualized return differences between the Unlucky and Lucky Investor in back tests for SPY, IWV, and QQQ are notable, but not devastatingly so. An investor would have to be extremely fortunate to perfectly time their investment or ETF purchase at the low point of the market every year and likewise extremely unfortunate to buy at the exact high point of the market every year. For SPY, from 1994 to 2020, the annualized difference between the Unlucky and Lucky investor is only 1.5%—somewhat comparable to the 1.1% difference Peter Lynch found in his earlier study across the less volatile period from 1965 to 1995—yet recognizably sizable when compounded over 27 years. Nonetheless, the 8.71% annualized return of the Unlucky Investor still seems respectable [see Table 1]. Just as notable, the annualized-return difference between the omniscient Lucky Investor and our consistent calendar-based start-of-year (SOY) Investor is considerably smaller: only 0.61% across 26 years of SPY investments. Investing earlier in the year (as the SOY Investor does) allows more time to earn dividends and compound returns; in flat markets, or markets that rise on average, this is an advantage.
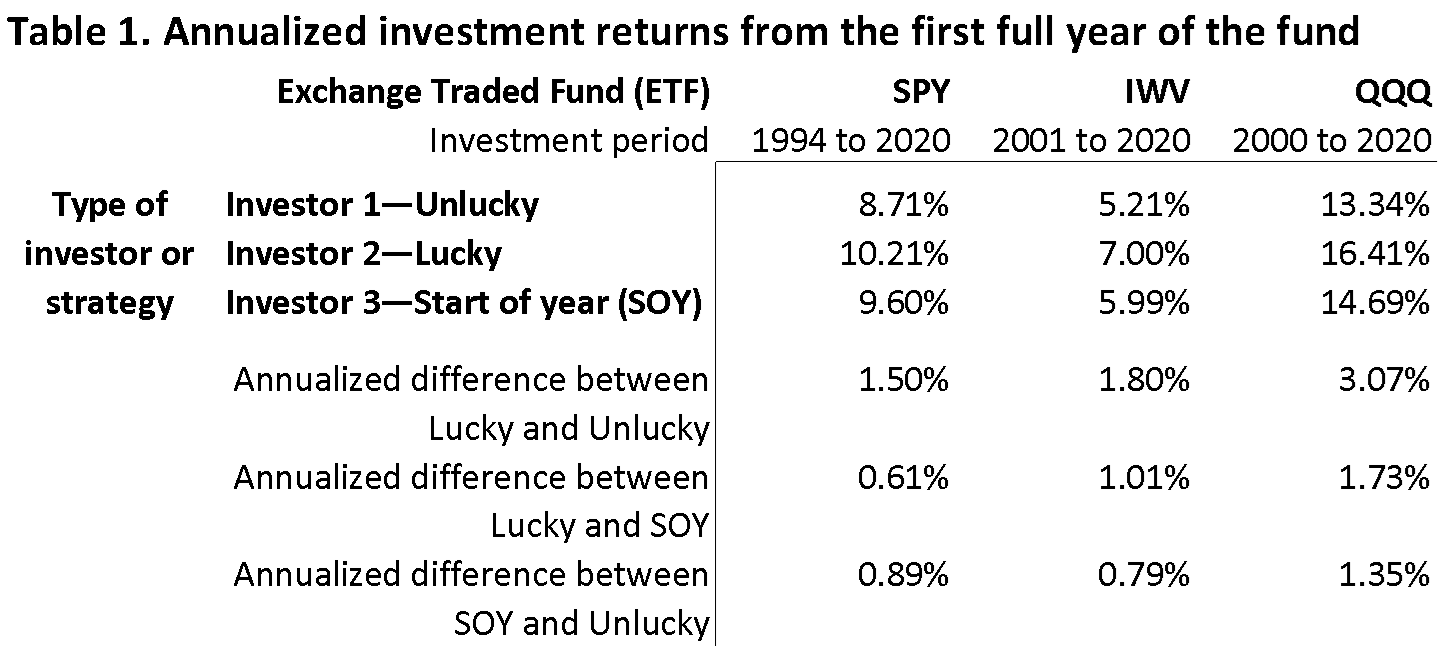
The time periods in Table 1 are not perfectly comparable across the three ETFs because each one has a different inception date, but the stories are similar. As expected, the Lucky Investor performs best, but Unlucky Investor, for all their ill-timed fate, still achieves a respectable return, as does the consistent Start-of-Year Investor, whose annualized return is only 0.79% to 1.35% less than Lucky Investor across all three funds and time periods in Table 1.
The performance differences between Investors 1, 2, and 3 may be more material when quoted in cumulative dollars rather than annualized percentages. For SPY, the 1.5% annualized difference between Unlucky Investor and Lucky Investor amounts to a cumulative difference of $1,381,955 versus $1,064,861, or $317,094 [see Table 2]; a sizable 23% disparity, yet even Unlucky Investor accumulates more than $1,000,000. The calendar-based SOY Investor accumulates a respectable $1,242,801, or approximately 10% less than Lucky Investor.
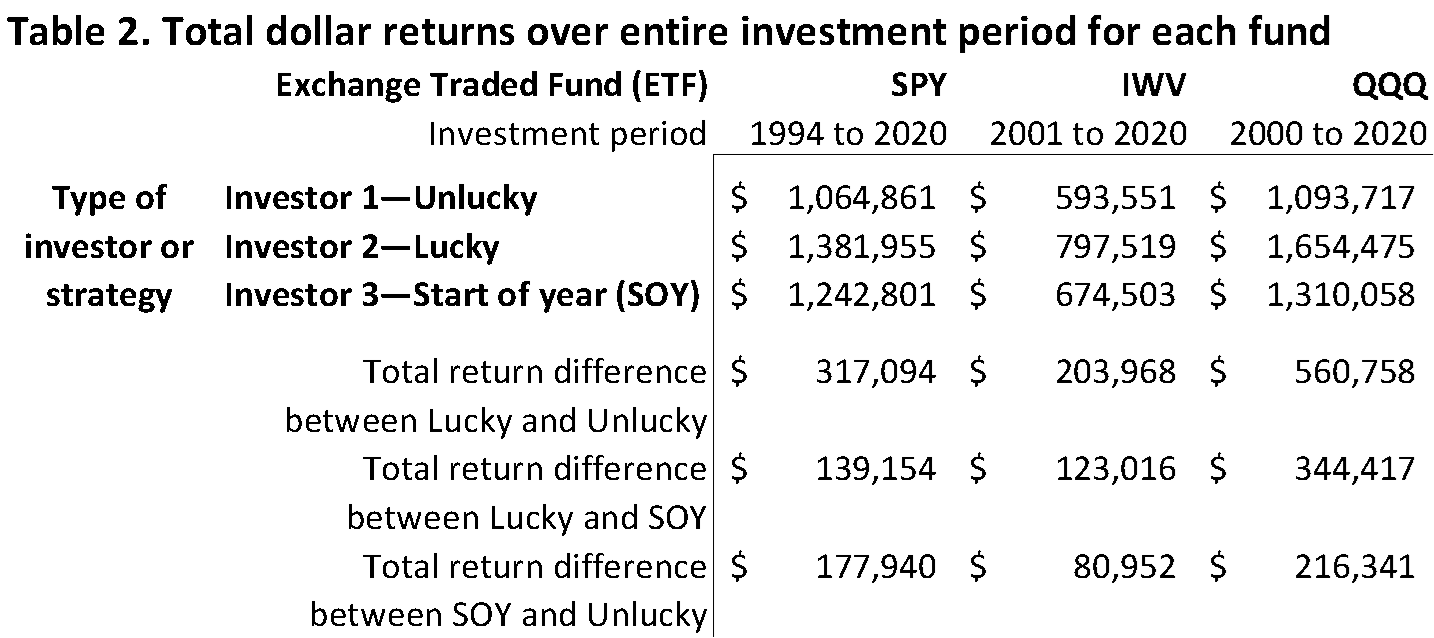
The cumulative dollar difference between Unlucky and Lucky Investors 1 and 2 is less severe for the IWV investments, but greater for QQQ, even though the time period is shorter. Lucky Investor gains $560,758 more in their QQQ portfolio than Unlucky Investor. However, because the investment periods are not the same, the dollar differences accumulated between SPY, IWV, and QQQ, are not truly comparable.
For Investors 1, 2, and 3, the rides are bumpy; not even the Lucky Investor has it smooth. They all ride out multiple huge market downdrafts during an economic slump in the early 2000s (when SPY experienced a 637-day peak-to-trough decline of -47.50%), the great financial crisis of 2007 to 2009 (when SPY experienced a 355-day peak-to-trough decline of -50.20%), and the great virus crisis of 2020 (when SPY experienced a 23-day peak-to-trough decline of -33.70%). On the other hand, by staying invested in the market and continuing to invest every year, each investor’s portfolio benefits from the market ascents following those declines.
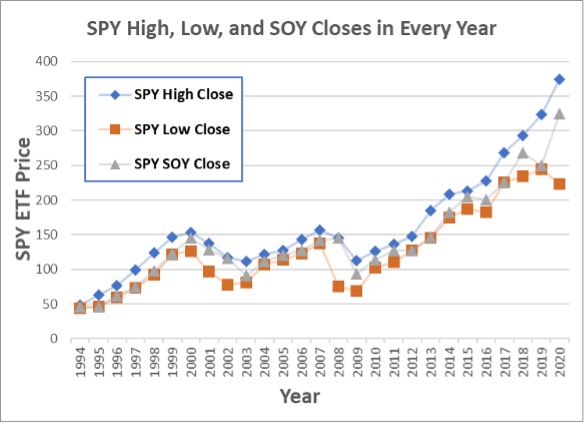
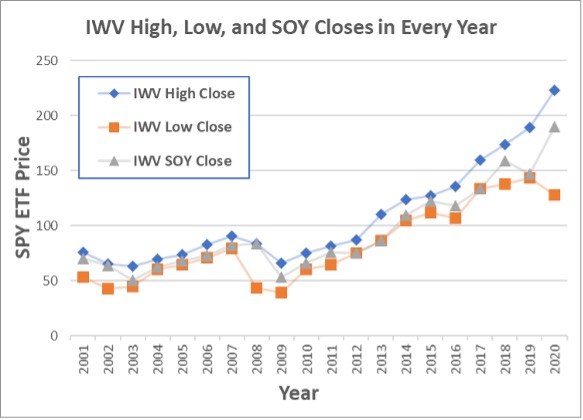
Over time, a flat to rising market combined with compounding returns can drown out the negative effects of some ill-timed market purchases. As might be expected, in especially volatile market years when there is a wide dispersion in price levels, the difference between the low price and the high price tends to be larger than in other years. For SPY, IWV, and QQQ, 2008, 2009, and 2020 were more volatile than usual. In 2008, our Unlucky Investor 1 bought into the market approximately 94% higher than our Lucky Investor 2. Similarly, in 2009 and 2020, our Unlucky Investor 1 bought into the market approximately 71% and 76% higher, respectively, than our Lucky Investor 2. The differences are visualized in Graphs 2, 3, and 4.
Note: As ETF prices increase, a 20% swing in prices is larger in absolute terms: For example, a 20% move up or down from $50 is only $10, whereas the same 20% swing from $250 equals $50, or five times greater.
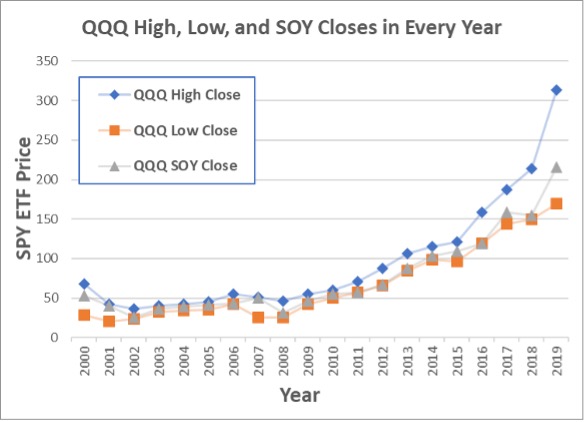
The largest percentage discrepancies between Unlucky and Lucky occur in 2000 and 2001 for investments in QQQ; our Unlucky Investor 1 buys into the market 111% and 140% higher, respectively, than our Lucky Investor 2. Nonetheless, Unlucky’s $10,000 QQQ investment in 2000 was worth $30,578 by the end of 2020; and the $10,000 QQQ investment in 2001 grew to $53,133 by year-end 2020. On the face of it, a greater than 100% difference in purchase levels two years in a row—especially at the beginning of one’s investment process—would seem devastating, but compounded over time across a steady investment program, such disparities can become muted.
Graphs 2, 3, and 4: SPY, IWV, and QQQ annual high, low, and start of the year closes.
Second look—Back-testing 3 modern funds across the last two decades: Similarities and differences between investors and investment strategies become more comparable when standardized across the same period of the last 20 years for which we have records. In Table 3 we see that over the last 20 full calendar years, the annualized performance differences between investing in SPY versus IWV is less than 0.1% for all three investors. For SPY, from 2001 to 2020, the annualized difference between Unlucky and Lucky is 1.76% (the rounded difference between 6.9% and 5.13%); for IWV, the annualized difference over the same period is a similar 1.80% (the rounded difference between 7.00% and 5.21%). The annualized-return difference between the omniscient Lucky Investor and a consistent calendar-based SOY Investor is considerably smaller: only an annualized 1% for investment in SPY and IWV.
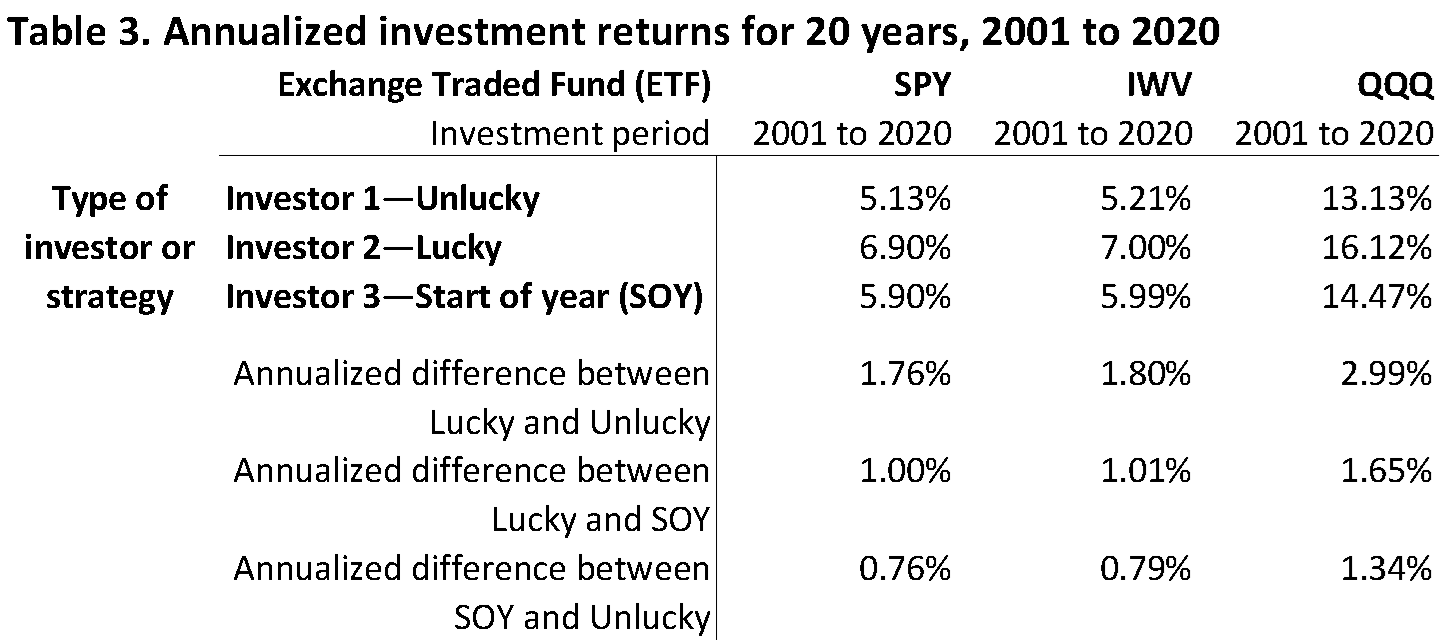
The performance differences are considerably more noticeable for investments in the much more volatile (higher beta[xvi]) QQQ. There, Lucky Investor annualizes at nearly 3% more than Unlucky Investor and a still-solid 1.65% more than our calendar-based start-of-year SOY Investor. Remarkably, however, even Unlucky Investor’s 13.13% annual QQQ return trounces the performance of Lucky Investor’s SPY or IWV return by over 6% annually.[xvii] Thus, whichever broad-based ETF or index one chooses, i.e., where one invests in U.S. equities may be even more critical to long-term returns than when one invests.
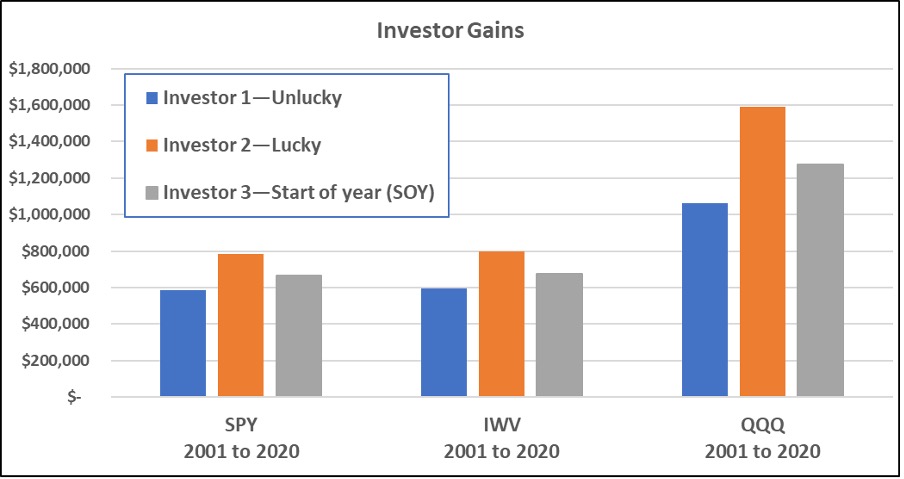
As before, the performance differences among Investors 1, 2, and 3 may seem more concrete when quoted in cumulative dollars rather than annualized percentages; additionally, they will now be more comparable because the returns are across the same 20-year period, from 2001 to 2020. In Table 4 we see that over the last 20 full calendar years, the cumulative dollar differences between investing in SPY versus IWV is less than $15K (or less than 2%) for all three investors.[xviii] For SPY, from 2001 to 2020, the cumulative difference between Unlucky Investor and Lucky Investor is $196,579; for IWV, the annualized difference over the same period is a similar $203,968. The cumulative dollar differences between our omniscient Lucky Investor and a consistent calendar-based investor are considerably smaller: approximately $120,000 in either SPY or IWV. However, investments in the more volatile QQQ produce more variance.
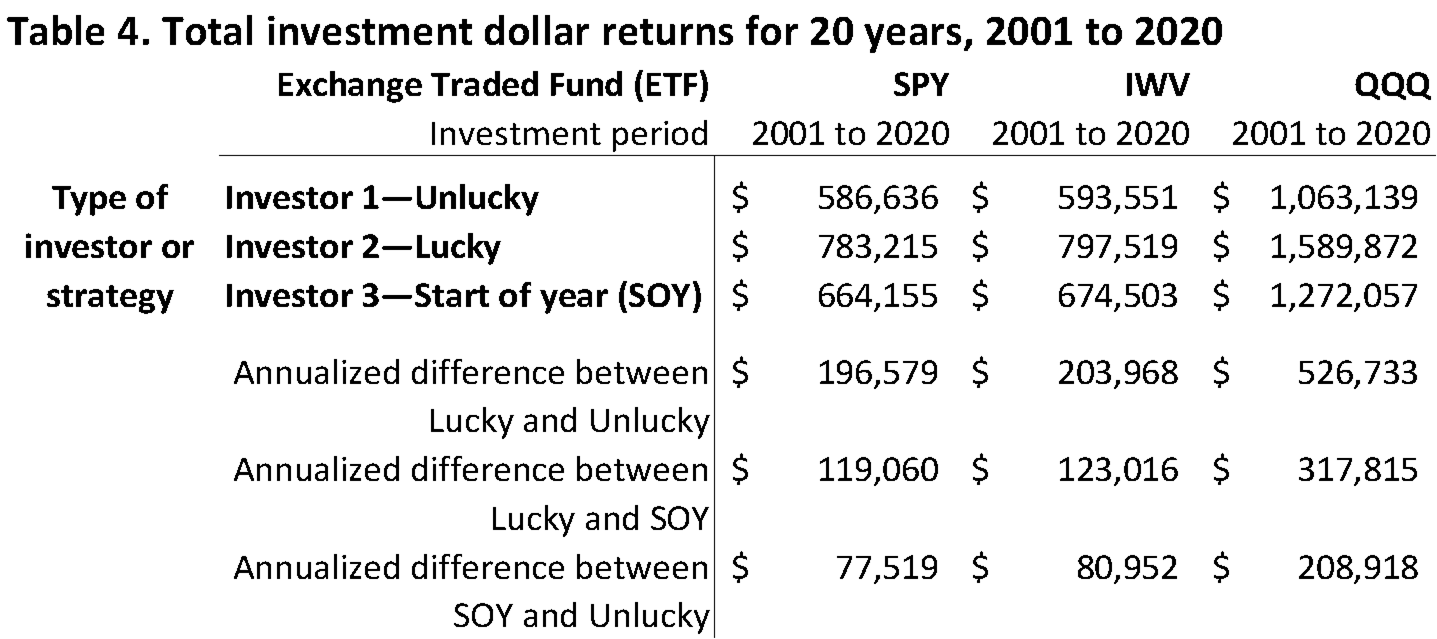
Lucky Investor gains $526,733 more in their QQQ portfolio than Unlucky Investor. Remarkably, however, even Unlucky Investor’s QQQ cumulative returns trounce the dollar returns of Lucky Investor’s SPY or IWV returns by over 79%, or approximately $470,000 [see Graph 5]. This helps reinforce the notion that where one invests in U.S. equities—i.e., which broad-based index one chooses to track—may be more critical to long-term returns than perfect market timing, or when one invests.
Graph 5: Comparable total returns for Unlucky Investor 1, Lucky Investor 2, and SOY Investor 3 in SPY, IWV, and QQQ, from 2001 to 2020.
Next steps—If not now, when? In the long run, it does not matter much whether one’s timing is good or bad—what matters is that one remains invested and selects a suitable allocation—invest early, invest often, and invest appropriately. There will be ups and downs in valuation. Understanding short- and long-term goals, having a financial plan, sticking to it, and ensuring enough cash flow for family and lifestyle needs can take one far. Peter Lynch expressed this in more down-to-earth terms during a PBS Frontline interview [xix]:
“If you’re in the market, you have to know there’s going to be declines. And they’re going to cap and every couple of years you’re going to get a 10 percent correction. That’s a euphemism for losing a lot of money rapidly. That’s what a ‘correction’ is called. And a bear market is 20-25-30 percent decline. They’re gonna happen. When they’re gonna start, no one knows. If you’re not ready for that, you shouldn’t be in the stock market. I mean stomach is the key organ here. It’s not the brain. Do you have the stomach for these kind of declines? And what’s your timing like? Is your horizon one year? Is your horizon ten years or 20 years?”
There are some investment precepts, such as market volatility as described by Lynch, that seem to have held well for the last few decades. For investors to earn a rational premium for owning stocks rather than bonds and cash—i.e., be compensated for shouldering the uncertainty of stock returns—stocks must sporadically lose value. Nonetheless, Running Point believes that we can manage these market precepts through personalization of investment, tax management, trust and estate structuring, and rigorous financial planning, all of which can improve investor growth and satisfaction. Some of the market declines described above can be tempered with proper asset allocation or possibly the addition of select private credit, private real estate, venture capital, private equity, or other bespoke specialized investments.
Running Point strives to maintain diversified portfolios that balance perceived outlooks with risks while we search for and analyze opportunistic investments. For those who can take advantage of illiquidity and have a long-term horizon, private credit funds, targeted real estate assets, venture capital, or other bespoke deals may offer unique prospects to achieve goals efficiently and effectively.
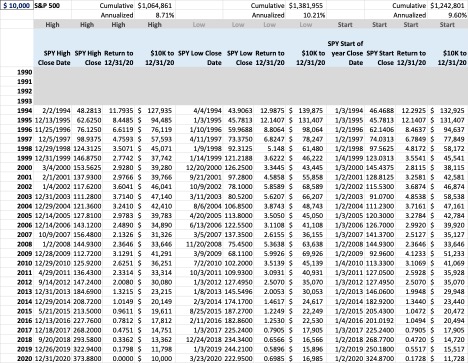
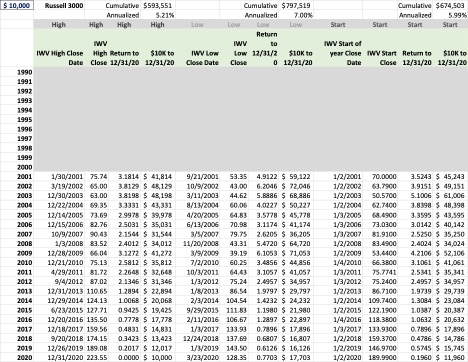
APPENDIX—Investment timing and strategy back testing return tables
Each table assumes a closing price (end of market day) transaction for the given date. Returns are calculated row by row from the given date and closing price to the closing price on 12/31/2020. Cumulative dollar ($) return calculations for an ETF sum the total dollar returns for each investment date of that ETF.
Total returns are inclusive of dividend reinvestment and the inherent expense ratios of the respective ETFs, but are gross of (do not include) transaction costs, taxes, and fees. Commission costs are currently zero at many major brokers, but this has not always been the case.
Appendix Table A:
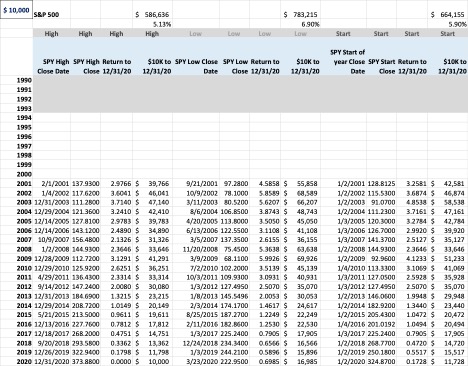
SPY Unlucky, Lucky, and Start of Year cumulative timing returns, 1994 to 2020
Appendix Table B:
IWV Unlucky, Lucky, and Start of Year cumulative timing returns, 2001 to 2020
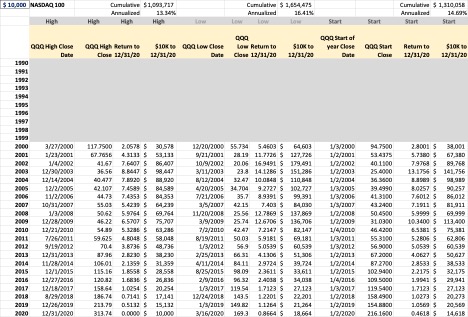
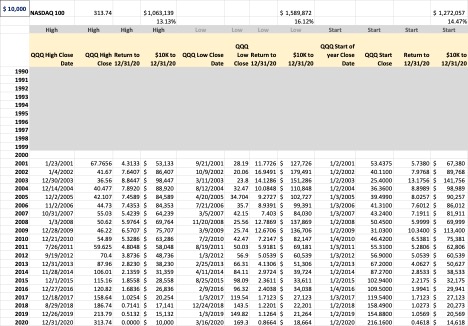
Appendix Table C:
QQQ Unlucky, Lucky, and Start of Year cumulative timing returns, 2000 to 2020
Appendix Table D:
SPY Unlucky, Lucky, and Start of Year cumulative timing returns, 2001 to 2020
Appendix Table E:
QQQ Unlucky, Lucky, and Start of Year cumulative timing returns, 2001 to 2020
Michael Ashley Schulman, CFA
Partner, Chief Investment Officer
[i] In other words: From 1994 to 2020, the annualized total return difference between the absolute best-timed investor and the absolute worst-timed investor in an S&P 500 fund was only 1.5%
[ii] Tom Gilovich, the Irene Blecker Rosenfeld Professor of Psychology at Cornell University, found in a 1994 research study that people tend to regret the things they had not done more than the things they had. “In the short term, people regret their actions more than inactions. But in the long term, the inaction regrets stick around longer.” https://www.futurity.org/regrets-ideal-selves-1770472/
[iii] Academic studies have shown that individuals lose between -0.5% and -4.5% annually because of emotional market responses; losses vary by study, time period, and index or fund type used for comparison. https://assetbuilder.com/knowledge-center/articles/are-investors-as-dumb-as-this-study-says
[iv] Psychologically, people generally feel that they should have more control over external short-term events versus external long-term events, although control is equally lacking. Additionally, short-term actions are fresher in the mind and therefore stand out more poignantly than actions taken years ago: i.e., one may regret the pint of Ben & Jerry’s ice cream they just ate, but one rarely regrets the pint they ate three years ago.
[v] When your long-term goals and investment objectives are years or decades away, progress checks on an hourly or daily basis will encounter significant random noise and be counterproductive—some of the investment problems stemming short-termism are highlighted in Nassim Taleb’s book, Fooled by Randomness.
[vi] Magellan performance was up more than 27 times during Mr. Lynch’s tenure.
[viii] There is an old joke about the unluckiest guy in the world:
Comrade 1: Friend, I’ve never seen someone so unlucky. The moment you touch something, it goes south. You are probably the unluckiest person in the world. In fact, if there was a contest for unlucky people, you’d end up in second place.
Comrade 2: Why only second place?
Comrade 1: Because you are that unlucky!
[ix] https://pdfcoffee.com/peterlynchworthmagazinearticles-pdf-free.html
Peter Lynch also said something similar in a PBS Frontline interview (date unknown): “People spend all this time trying to figure out ‘What time of the year should I make an investment? When should I invest?’ And it’s such a waste of time. It’s so futile. I did a great study, it’s an amazing exercise. In the 30 years, 1965 to 1995, if you had invested a thousand dollars, you had incredible good luck, you invested a the low of the year, you picked the low day of the year, you put your thousand dollars in, your return would have been 11.7 compounded. Now some poor unlucky soul, the Jackie Gleason* of the world, put in the high of the year. He or she picked the high of the year, put their thousand dollars in at the peak every single time, miserable record, 30 years in a row, picked the high of the year. Their return was 10.6 That’s the only difference between the high of the year and the low of the year. Some other person put in the first day of the year, their return was 11.0. I mean the odds of that are very little, but people spend an unbelievable amount of mental energy trying to pick what the market’s going to do, what time of the year to buy it. It’s just not worth it.” https://www.pbs.org/wgbh/pages/frontline/shows/betting/pros/lynch.html
[x] Note that portfolio manager, author, and investment blogger, Ben Carlson, CFA wrote a blog titled What if You Only Invested at Market Peaks? in 2014 about a fictional investor named “Bob, The World’s Worst Market Timer” that only invested at market peaks into an S&P 500 index fund starting in 1972 (although an investable fund of this type didn’t come into being “until 1977 when the Vanguard 500 Fund had its first full year”) and ending in 2013. The methodology, however, is much different than Lynch’s and only focuses on one type of investor, and much of the story’s numerical background data is missing. Although this examination is simpler than Lynch’s and the timing is different, the benefits of accumulating wealth by staying invested and compounding over time holds.
[xi] Note that Nick Maggiulli, investment blogger and COO for Ritzgoltz Wealth Management LLC wrote a 2019 market timing article, Even God Couldn’t Beat Dollar-Cost Averaging, that compared a dollar-cost averaging (DCA) strategy that invests $100 per month to a buy the dip strategy that invests “exactly when the market is at the absolute bottom between any two all-time highs.” The methodology, however, is much different than Lynch’s and only focuses on two types of investor. Maggiuilli’s conclusion is that “over 70% of the time, Buy the Dip underperforms DCA”.
[xii] Wesley Gray, Phd, wrote Even God Would Get Fired as an Active Investor in 2016 regarding market timing: “Our bottom line result is that perfect foresight has great returns, but gut-wrenching drawdowns. In other words, an active manager who was clairvoyant (i.e. “God”), and knew ahead of time exactly which stocks were going to be long-term winners and long-term losers, would likely get fired many times over if they were managing other people’s money.”
[xiii] Usually trade intraday with a tight bid/ask spread (i.e., they have a minimal difference between the buy and sell price).
[xiv] VOO (the Vanguard S&P 500 ETF with an expense ratio of 0.03% and an inception date of 9/9/2010) and IVV (the iShares Core S&P 500 ETF with an expense ratio of 0.03% and inception date of 5/19/2000) are two other well-known U.S.-based ETFs that also track the S&P 500 and do so for a lower fee than SPY, but their track records are not nearly as long as SPY.
[xv] QQQM (the Invesco NASDAQ 100 ETF with an expense ratio of 0.15% and an inception date of 10/13/2020) also tracks the NASDAQ-100 Index, but it is not nearly as large nor as actively traded as QQQ.
[xvi] Beta is a measure of volatility or systematic risk; the market is usually assumed to have a beta of 1. More volatile or higher beta investments tend to decline more than the market on downdrafts and conversely go up more than the market on ascents. That said, beta and volatility measurements have their limitations.
[xvii] The difference between Investor 1’s Unlucky QQQ annualized return of 13.13% and Investor 2’s Lucky IWV return of 7.00% is a gaping 6.13%; and compared to Investor 2’s Lucky SPY return of 6.90%, it is an even wider 6.23%.
[xviii] This is not surprising because SPY and IWV are highly correlated and more than 80% of IWV’s returns come from names in SPY.
[xix] https://www.pbs.org/wgbh/pages/frontline/shows/betting/pros/lynch.html
* Lynch probably refers here to Ralph Kramden, a hapless character famously played by Jackie Gleason on a television show called The Honeymooners; hence the Wikipedia hyperlink to that show—“The show was based on Ralph’s many get-rich-quick schemes, his ambition, antics with his best friend and neighbor, scatterbrained sewer worker Ed Norton, and clashes with sensible wife Alice, who typically pulled Ralph’s head down from the clouds.” In the real world, Gleason was a successful and larger-than-life character, though surely not without his own faults too.
Disclosure: The opinions expressed are those of Running Point Capital Advisors, LLC (Running Point) and are subject to change without notice. The opinions referenced are as of the date of publication, may be modified due to changes in the market or economic conditions, and may not necessarily come to pass. Forward-looking statements cannot be guaranteed. Running Point is an investment adviser registered with the U.S. Securities and Exchange Commission. Registration does not imply a certain level of skill or training. More information about Running Point’s investment advisory services and fees can be found in its Form ADV Part 2, which is available upon request. RP-21-12