- It’s a holiday week; therefore, I want YOU (not me) to determine what will be
- Where will the S&P 500 be in several years?
- What does that mean in terms of annual returns with and without dividends?
- Since 1931, the S&P 500 price index has compounded at 6.83% per year
- Since 1931, the S&P 500 with dividends reinvested has compounded at 10.67% per year
- If the S&P 500 price index reclaims its February high in five years, that will equate to a 6% annual return with dividends reinvested, which is a pretty good return in a zero percent world
- Predicting what markets may look like, can help you set expectations and comfort levels
I desire to take this holiday week off, so rather than make a prediction myself, I want to supply you the tools to predict the future. First, let’s define and simplify; we will concentrate on the S&P 500 equity index, an index of 500 large-capitalization U.S. stocks, and within the S&P 500 equity index, I only ask you to predict what annual returns will be for the next several years.
Now, in order to predict the future, it sometimes helps to start with the recent past and present.
- The past: The S&P 500 recently reached an all-time high closing level of 3,386.15 on February 19, 2020
- The S&P 500 also recently reached a 29-month low closing level of 2,237.40 on March 23, 2020 (a level not seen since December 2016)
- The present: The S&P 500 closed Thursday, April 9, 2020, at 2,789.82
- The difference: There is a 596.33 point difference between the recent high level and the market close on April 9
- Thus, the S&P 500 is 17.61% (596.33 / 3,386.15) below its all-time high; however, because percentages work in funny ways, the S&P 500 must rise by 21.38% (596.33 / 2,789.82) to match its old high level
In the first quarter of 2020, the longest equity bull market in U.S. history came to an abrupt, virus induced, halt. In the past seven weeks, the market crested, crashed, and regained about half its decline.
Your mission, should you choose to accept it, is to predict (guess), how long it will take for the S&P 500 to reclaim its high point – one year, two years, ten years – or if it even reclaims it? Whether it reclaims, surpasses, or falls short of its old high will be your prediction, not mine! But as I’ve stated previously, U.S. asset values seem to have the aligned backing of the Federal Reserve (headed by Jerome Powell, the U.S. Treasury (headed by Steven Mnuchin), the White House, and the Legislature; and that is an incredibly strong force to bet against; i.e., don’t fight an aligned central bank and government.
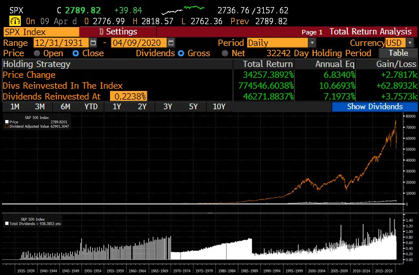
Graph 1: SPX 500 Returns from 12/31/1931 to 4/9/2020 (today)
Graph 2: SPX 500 Returns from 12/31/1931 to the recent low on 3/23/2020
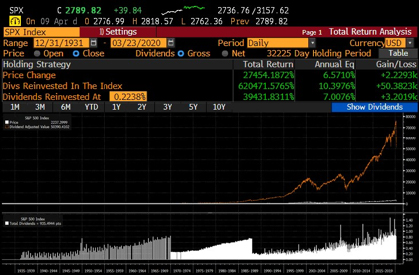
Historical annualized returns of six-and-a-half to ten-and-a-half percent. Now to provide you some more information. As shown in Graph 1, above, from December 31, 1931, through April 9, 2020, the S&P 500 index has enjoyed an annualized index price change of 6.83% (for a 34,257% total return); however, if dividends were reinvested in the index, the annualized return is 10.67% (for a 774,547% total return). Had we taken this measurement on March 23, 2020, [Graph 2] at the recent market low, annualized price return would be a slightly lower 6.57% and annualized return with dividends reinvested would be 10.40%. Either way, over the last 88 years – through World War II, the Cold War, countless other wars, John F. Kennedy and Martin Luther King assassinations, earthquakes, 9/11, hurricane Katrina, and market crashes – U.S. stocks have annualized at a decent clip. How different will the future look from the past?
Table 1: Predicted Annualized S&P 500 Price Returns
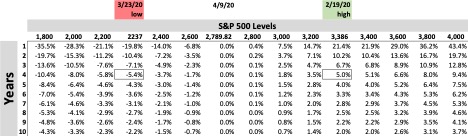
Table 1 shows what annualized returns would be based on various future levels of the S&P 500 price index and the number of years it will take to get there. For example, if the future level is the same as the current level, 2,789.82, then future annualized returns are zero percent across all periods. If the S&P 500 regains its previous high level in four years, annualized price returns are 5%; conversely, if it retreats back to its March 23 low after four years, annualized price returns will be a disappointing -5.4%. Where do you think the S&P 500 will be as the U.S. progresses through the pandemic crisis and how long will it reasonably take to get there? By choosing a level and number of years, you can approximate what the annual return will be for the price index.
In addition to the price return, let’s assume a dividend yield of 2%. The trailing twelve-month yield on the S&P 500 is 2.17%; this means that for every $1,000 one had invested in the S&P 500 over the last year, one would have received approximately $21.70 in dividends which could be reinvested in stocks. In other words, hypothetically, had the value of the index itself not changed, your $1,000 investment would be worth $1,021.70. Over ten years, just the compounding of this yield (not accounting for taxes) would raise your value to $1,239.46 ($1,000 * 1.0217^10). For our purposes, since some companies have already cut or eliminated their dividend in the wake of the pandemic, and I expect more will, let’s assume a dividend yield of 2%. We can use this 2% yield as an input for our predicted annualized returns and update Table 1 with Table 2.
Table 2: Predicted Annualized S&P 500 Returns with Dividends Reinvested (assumes a 2% annual dividend yield)
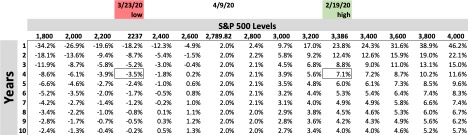
Table 2 displays what annualized returns would be based on various future levels of the S&P 500 price index (with dividends reinvested) and the number of years it will take to get there. For example, if the future level is the same as the current level, 2,789.82, then future annualized returns are two percent across all periods. If the S&P 500 regains its previous high level in four years, annualized price returns are 7.1%; conversely, if it retreats to its March 23 low after four years, annualized price returns will be a less disappointing -3.5%. Based on the S&P level and number of years you chose for Table 1, see what the annual return now is. Because dividends can be a significant contributor to total return, in all situations, annualized returns are better than without dividends.
Over the last seven weeks, the S&P 500 index has quickly and erratically declined -17.61% from its record closing high to its current level. If it takes a long four years to make up for the last seven weeks and for the equity index to reclaim its old high, that could still equate to a solid 7.1% annualized return including dividend reinvestment[1], which is a relatively strong return in a low interest rate world were the 1-year Treasury yields 1% and the 30-year Treasury yields 1.34%. The historical compounded equity returns of approximately 10.5% (for the S&P 500 with dividends reinvested) that we saw over the last 88 years occurred in a higher interest rate regime and probably won’t be repeated over the next decade if interest rates remain in this likely lower for longer environment. By predicting a future equity index level and number of years to achieve that level, you can not only approximate what annual returns may be, but even more importantly, set expectations and comfort levels that help you frame market volatility.
Michael Ashley Schulman, CFA
Partner, Chief Investment Officer
[1] Assumes a 2% dividend yield and does not account for taxes.
Note: Dividend yields may average significantly less than 2%, annualized price returns may very well average significantly less than 6.5%, and annualized total returns will probably average significantly less than 10.5%.
Disclosure: The opinions expressed herein are those of Running Point Capital Advisors, LLC (“Running Point”) and are subject to change without notice. Running Point reserves the right to modify its current investment strategies and techniques based on changing market dynamics or client needs. This should not be considered investment advice or an offer to sell any product. Running Point is an independent investment adviser registered under the Investment Advisers Act of 1940, as amended. Registration does not imply a certain level of skill or training. More information about Running Point, including our investment strategies, fees and objectives can be found in our ADV Part 2, which is available upon request. RP-20-08